

The author Jukka Aalho is a full-stack marketer, author and founder of Aalho Media.
Data-driven marketing and swallows have a lot in common. The human touch brings both to ruin.
This article is for you if you are
- a company offering expert marketing services
- junior analytics professional or
- the person responsible for reporting your silo’s performance
When it comes time to do the monthly reporting, both the buyer and the seller are feverishly thinking about how to make the report look as good as possible. This article is suitable for both the buyer and the seller, but is written mainly from the seller’s point of view. Use the tips in this article only for good.
The seller, i.e. for example an advertising agency, thinks about these questions:
- How can I get a report that looks as good as possible with as little effort as possible?
- How do I get the customer to remain a customer?
The buyer, i.e. the customer company, thinks about these questions:
- How can I get a report that looks as good as possible with as little effort as possible?
- How can I keep job?
Both have the same needs and wants. Here are 4 tips that you can use to trick yourself and others into thinking that you are fishing for insights from the data lake and not just idly sitting by and chewing on a straw.
1. Change the metrics to track from report to report
The guidelines for an honest swindler are very simple: you can’t lie, but you don’t have to tell the truth.
The simplest and most effective way is to change the monitored metrics from one report to another. This is easiest when you have not agreed on how success will be measured, but you get to serve the metrics on a silver platter.
So choose the metrics of the month based on what makes your work look the best. Has the CPA (cost-per-acquisition) increased? Delete it. Has the CPC (cost-per-click) increased? Delete it.

How long will it take you to get answer A?
Remember that reports are not read with reason but with feeling. It doesn’t matter that the increase in the click price is due to the fact that you have no longer wasted the budget on spam clicks but found a working target audience.
The rule of thumb when it comes to expenses is simple: Big number = bad number.
You can use this method even if you have agreed on common metrics. Just change the order and weight from report to report. The most important thing is that you don’t get an overview of how the business is changing.
2. Harness the comparison period to tell the story you want
There’s an old tip for writing a good scene: start late and finish early. You can also use this trick in marketing reporting.
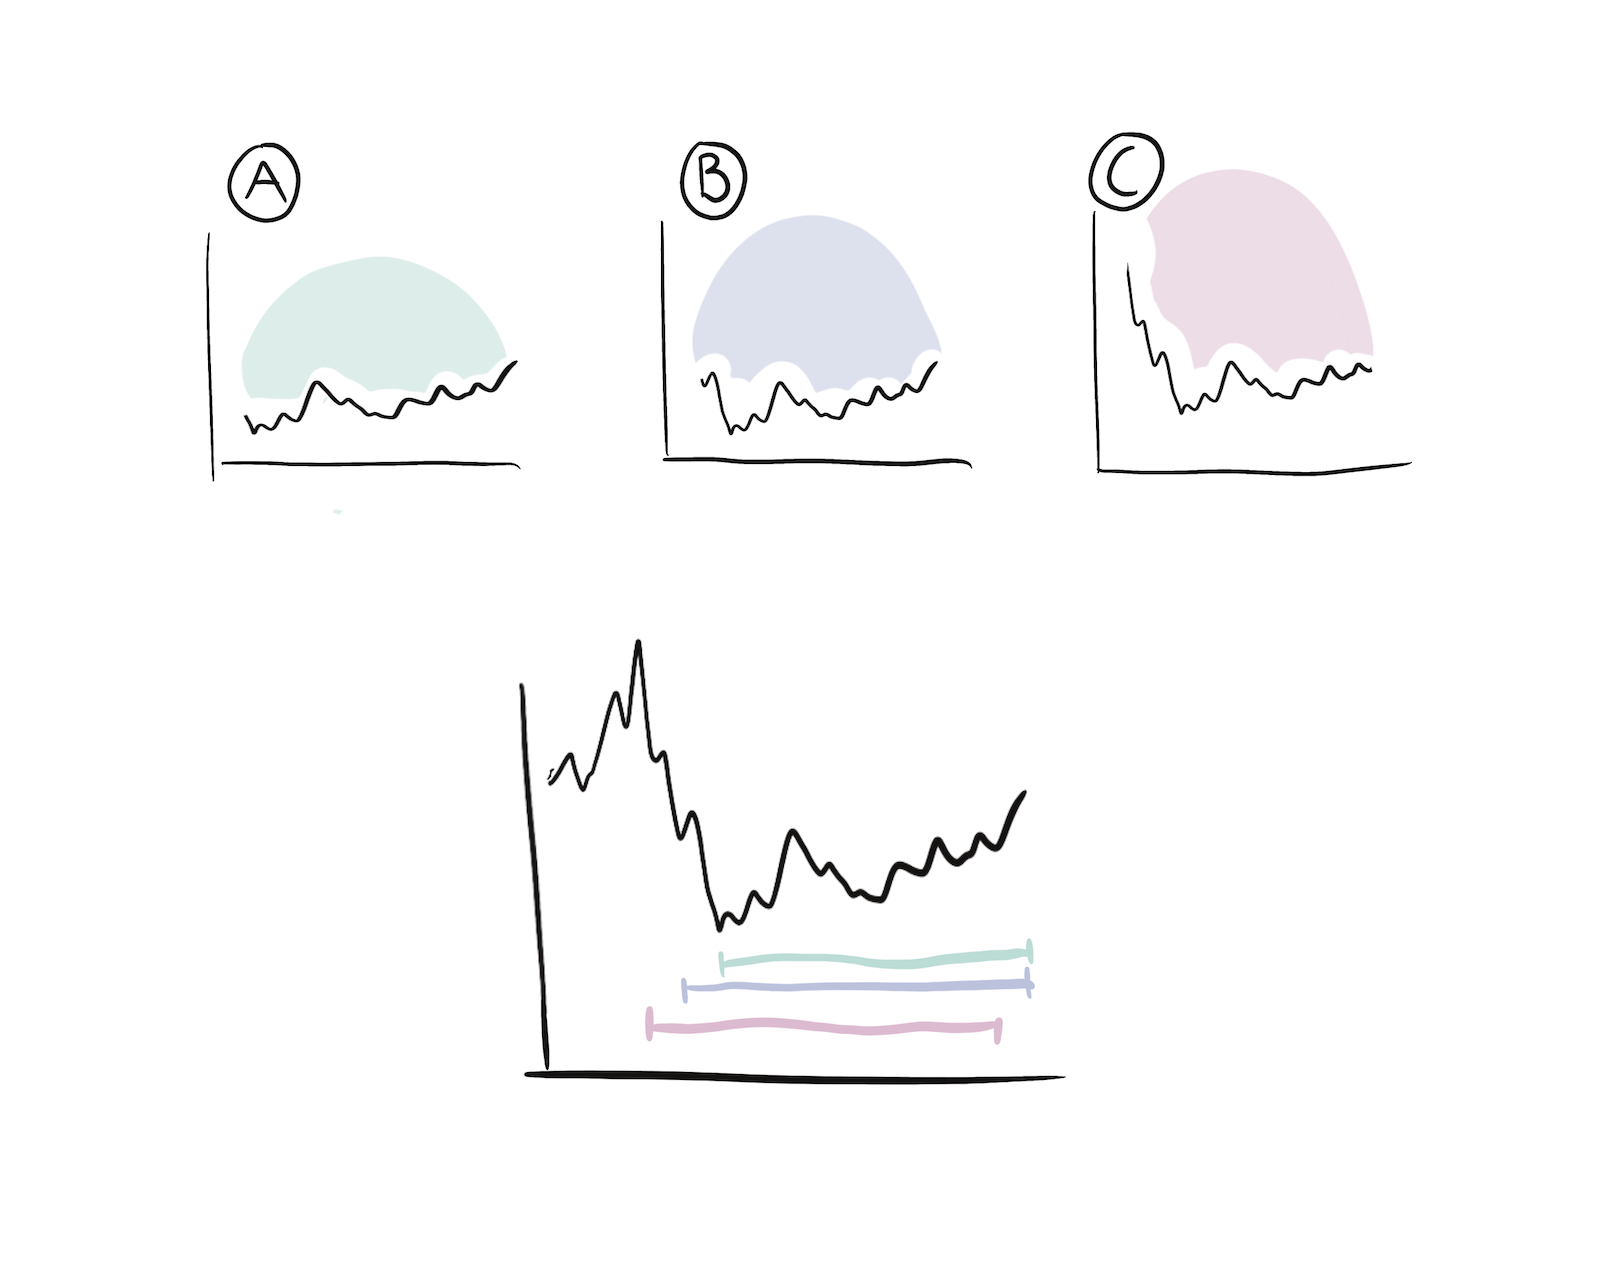
Below are three graphs of the number of visitors to the campaign website. Just by sliding the date, you get three different stories from the same data:
A. “Everything’s a OK”
B. “Chugging along nicely”
C. “Crisis mode on and heads rolling”
A junior analyst may fall victim to the illusion that the period of time for monthly reporting must be a month. Make clear to your client that you are measuring phenomena and not days and in fact the whole term monthly report actually refers to the fact that the report is done on a monthly basis.
3. The cumulative sum cannot go down
Remember when we talked about reading reports with emotion, not reason? Let’s add to the thesis that reports are read with the eyes, not the brain.
On the results side, the upward pointing curve is the only curve worth sharing. Up is good. Downward is bad.
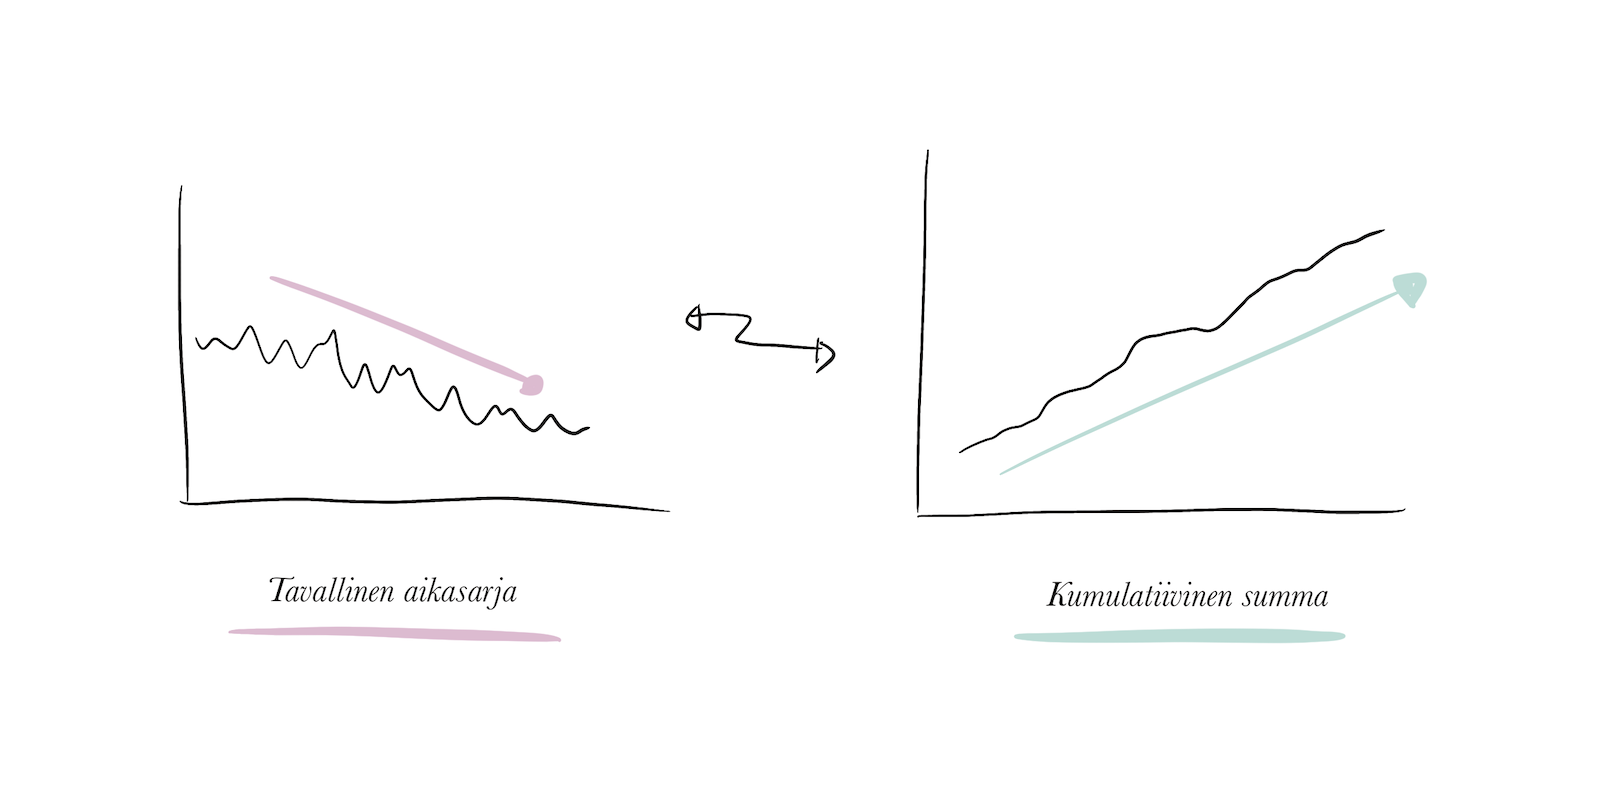
Unfortunately, the reality doesn’t always match the report, but then you can call the fifth superhero from the Turtles: Cumulative Sum. One of the properties of a cumulative sum is that it cannot point downward.
4. Never go back to old reports
The purpose of reporting is to report – in the same way that the purpose of brushing teeth is brushing your teeth. The fourth tip is perhaps the most important of all: never go back to old reports.
It’s helpful if:
- the format of the report keeps changing
- reports are not stored in a specific location
- reported metrics keep changing
At least every six months, it’s good to tweak the reporting period as well. For example, you can report monthly at first, then rolling four weeks, and then return to monthly reporting again.
Additional tip: only you know the best ways
I can only suggests tips for good marketing report swindling, but only you know the best ways. You know what gets your customers or organization fired up. Maybe it’s the fact that the brand color is exactly right instead of the numbers. Maybe it’s that one slide has only one graph and at least one red line drawn on it.
However, remember that both the buyer and the seller have the samegoal: both want to make the analytics look good.
I believe that together you can do it.


Leave a Reply